Figure 2 - performance improvement

© SCHAUMANN
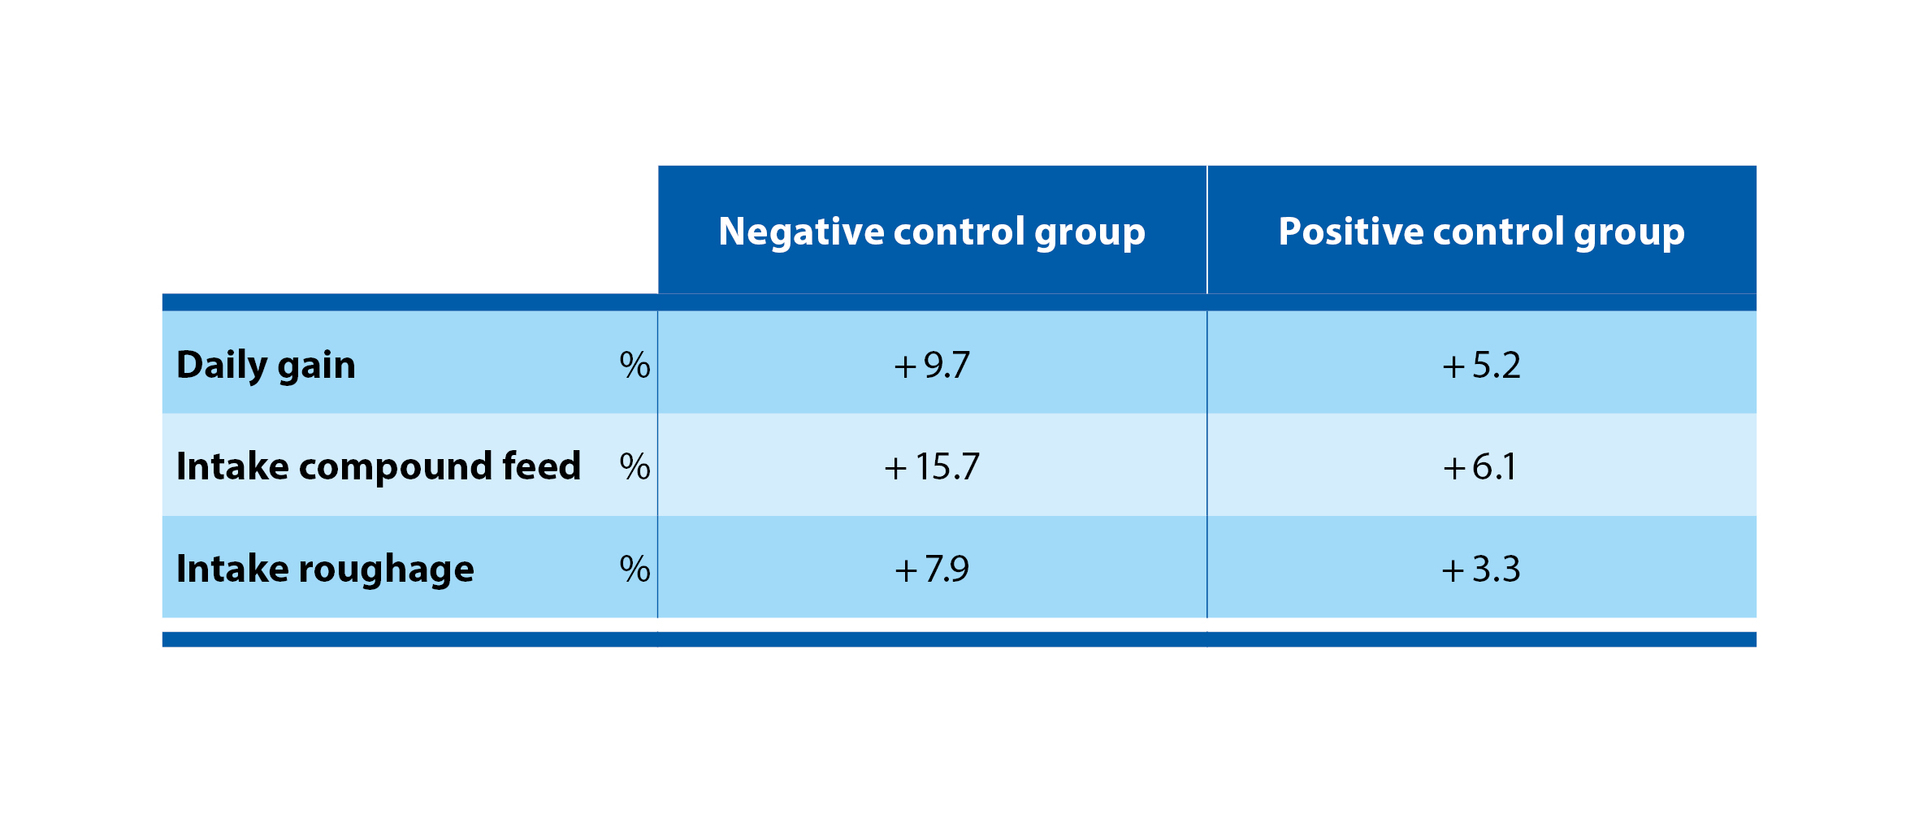
Figure 2: Performance improvement by PROVITA LE – figures in % of the negative or positive control group


Figure 2: Performance improvement by PROVITA LE – figures in % of the negative or positive control group